A simple, feature-rich alternative to Google Analytics
Switch to Metrics Hive, a superior alternative to Google Analytics. Enjoy simplicity, long-term data retention, and full GDPR compliance without compromising your time or your visitors' digital privacy.
Simple, friendly user interface
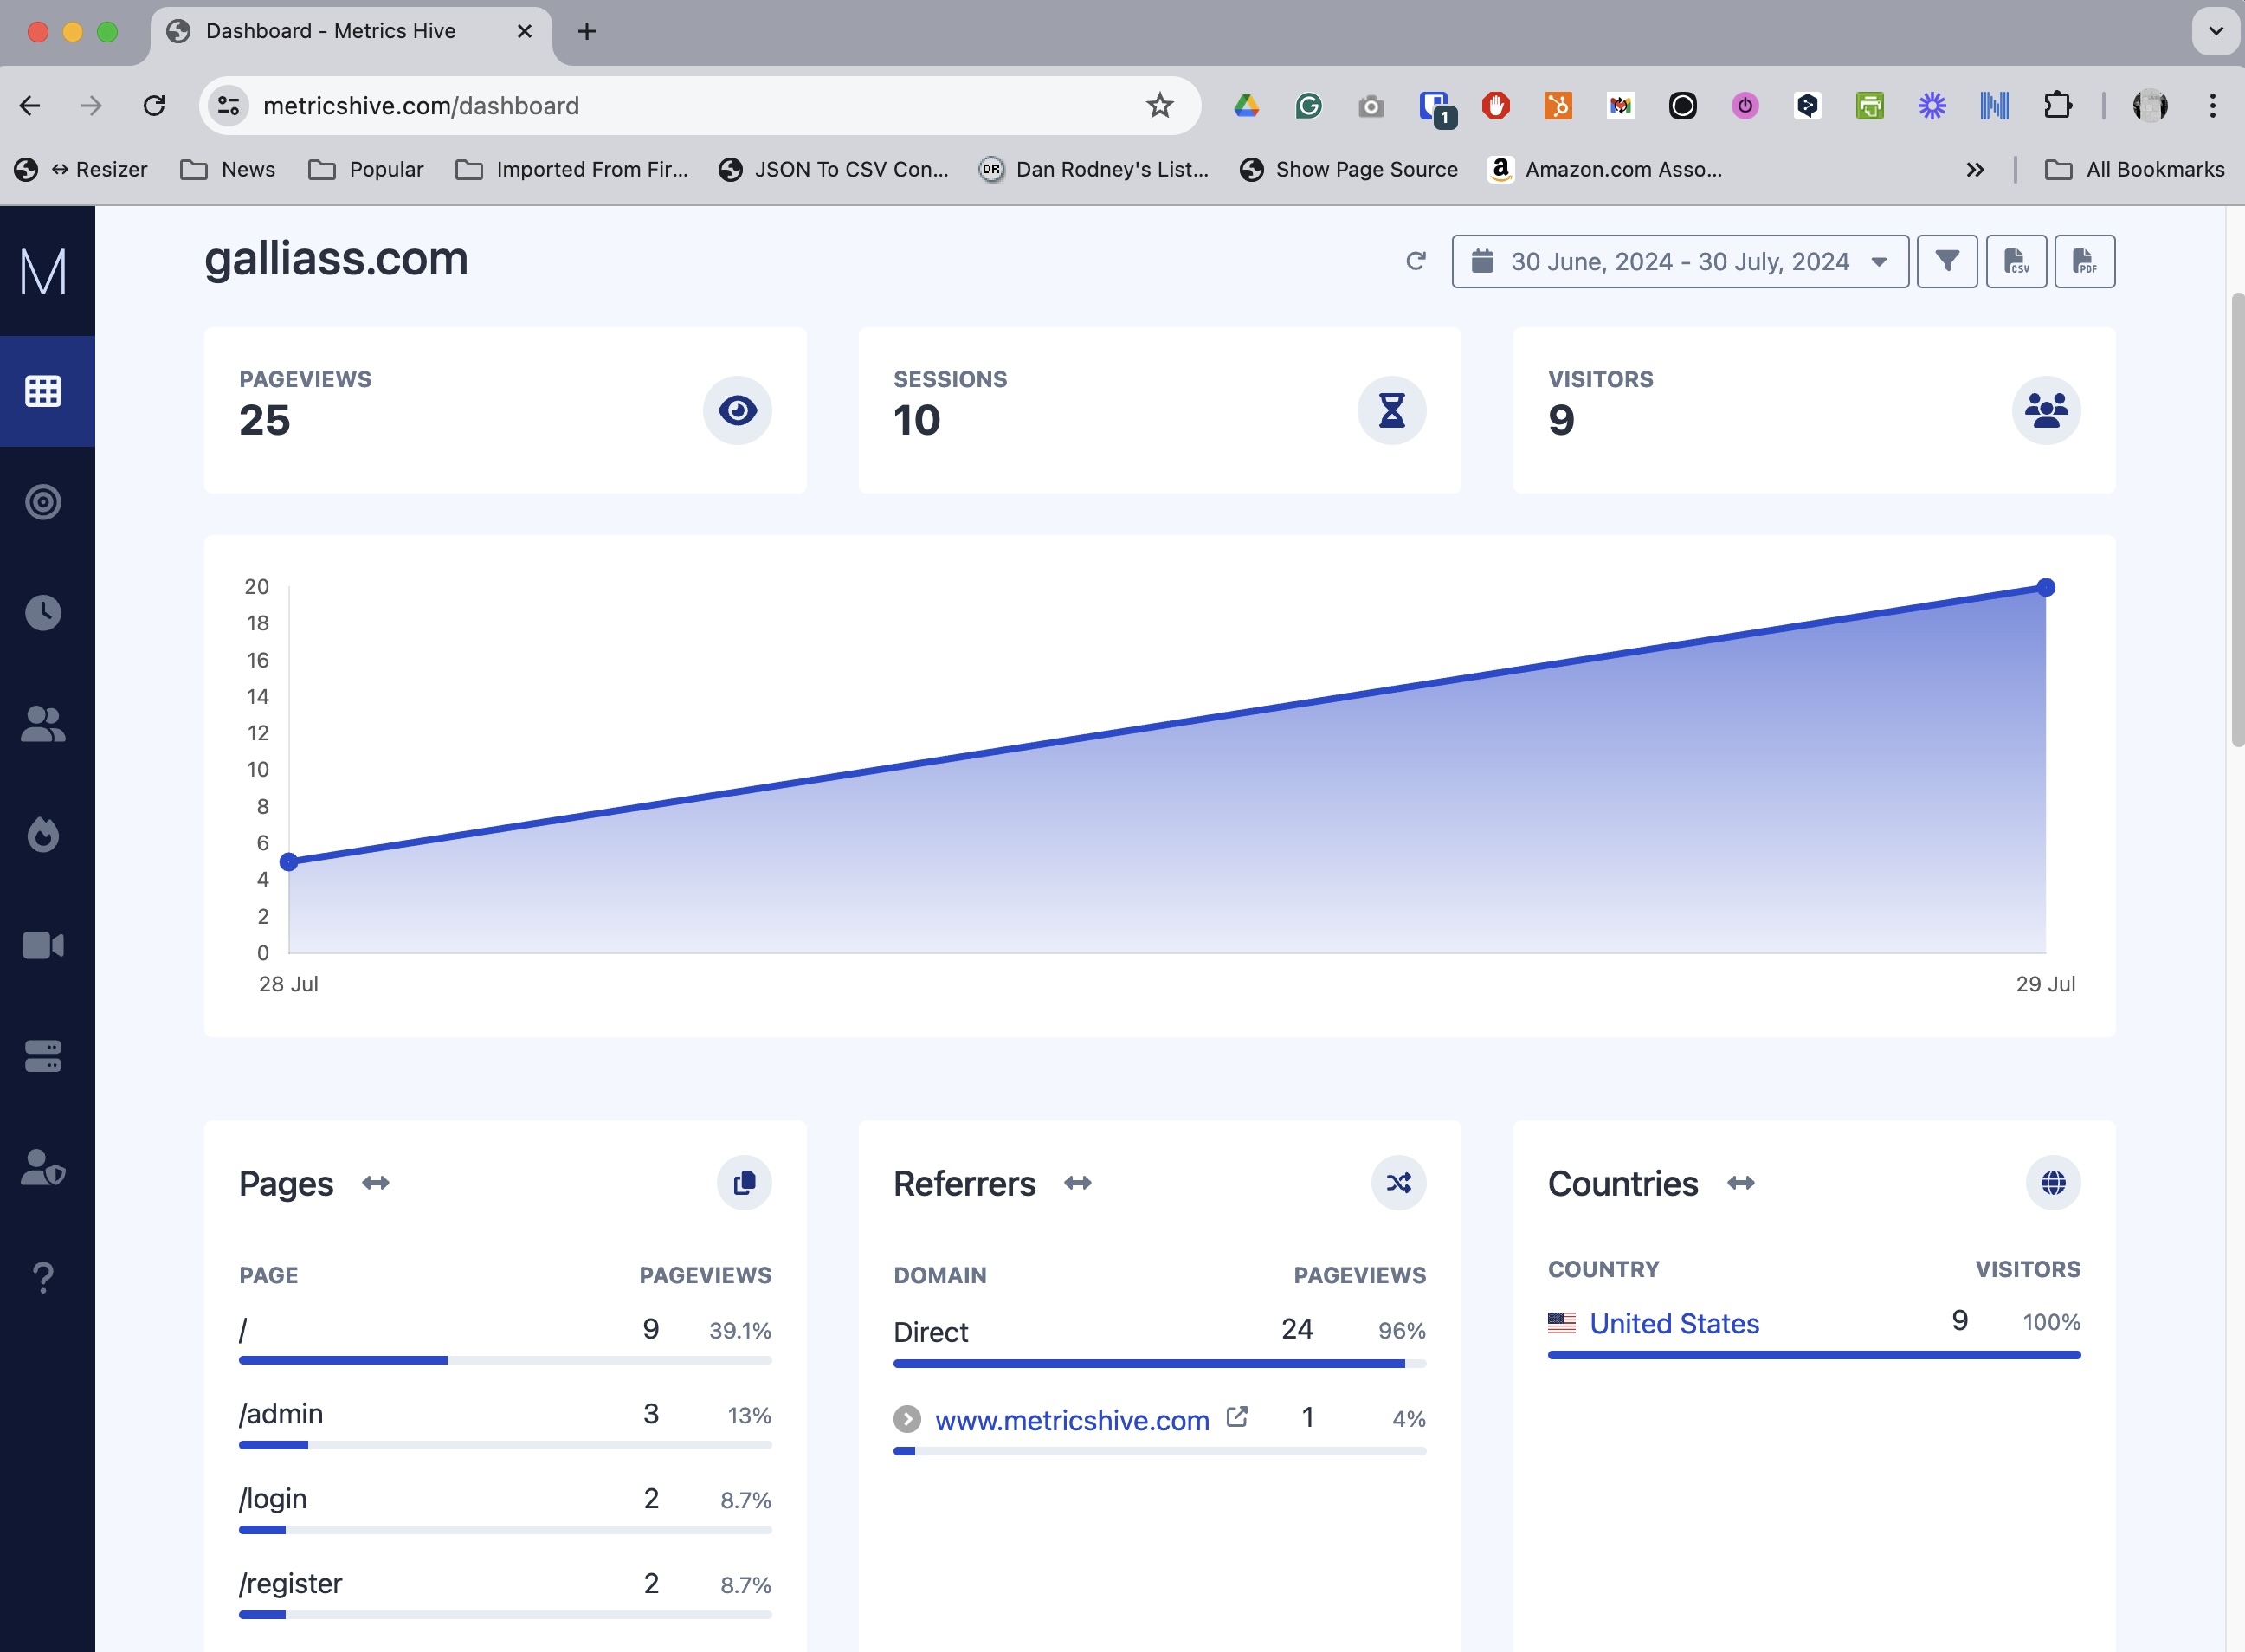
Have you ever felt like you have too much information in front of you and don't know what it means? We are providing you a clean and simple interface with easy to understand analytics.
-
Quick install with one line of code
-
Modern interface with a centralized dashboard
-
Easy transition from Google Analytics
-
Create Goals, view Campaigns, understand Customer Journeys, and more.

Insights at a glance
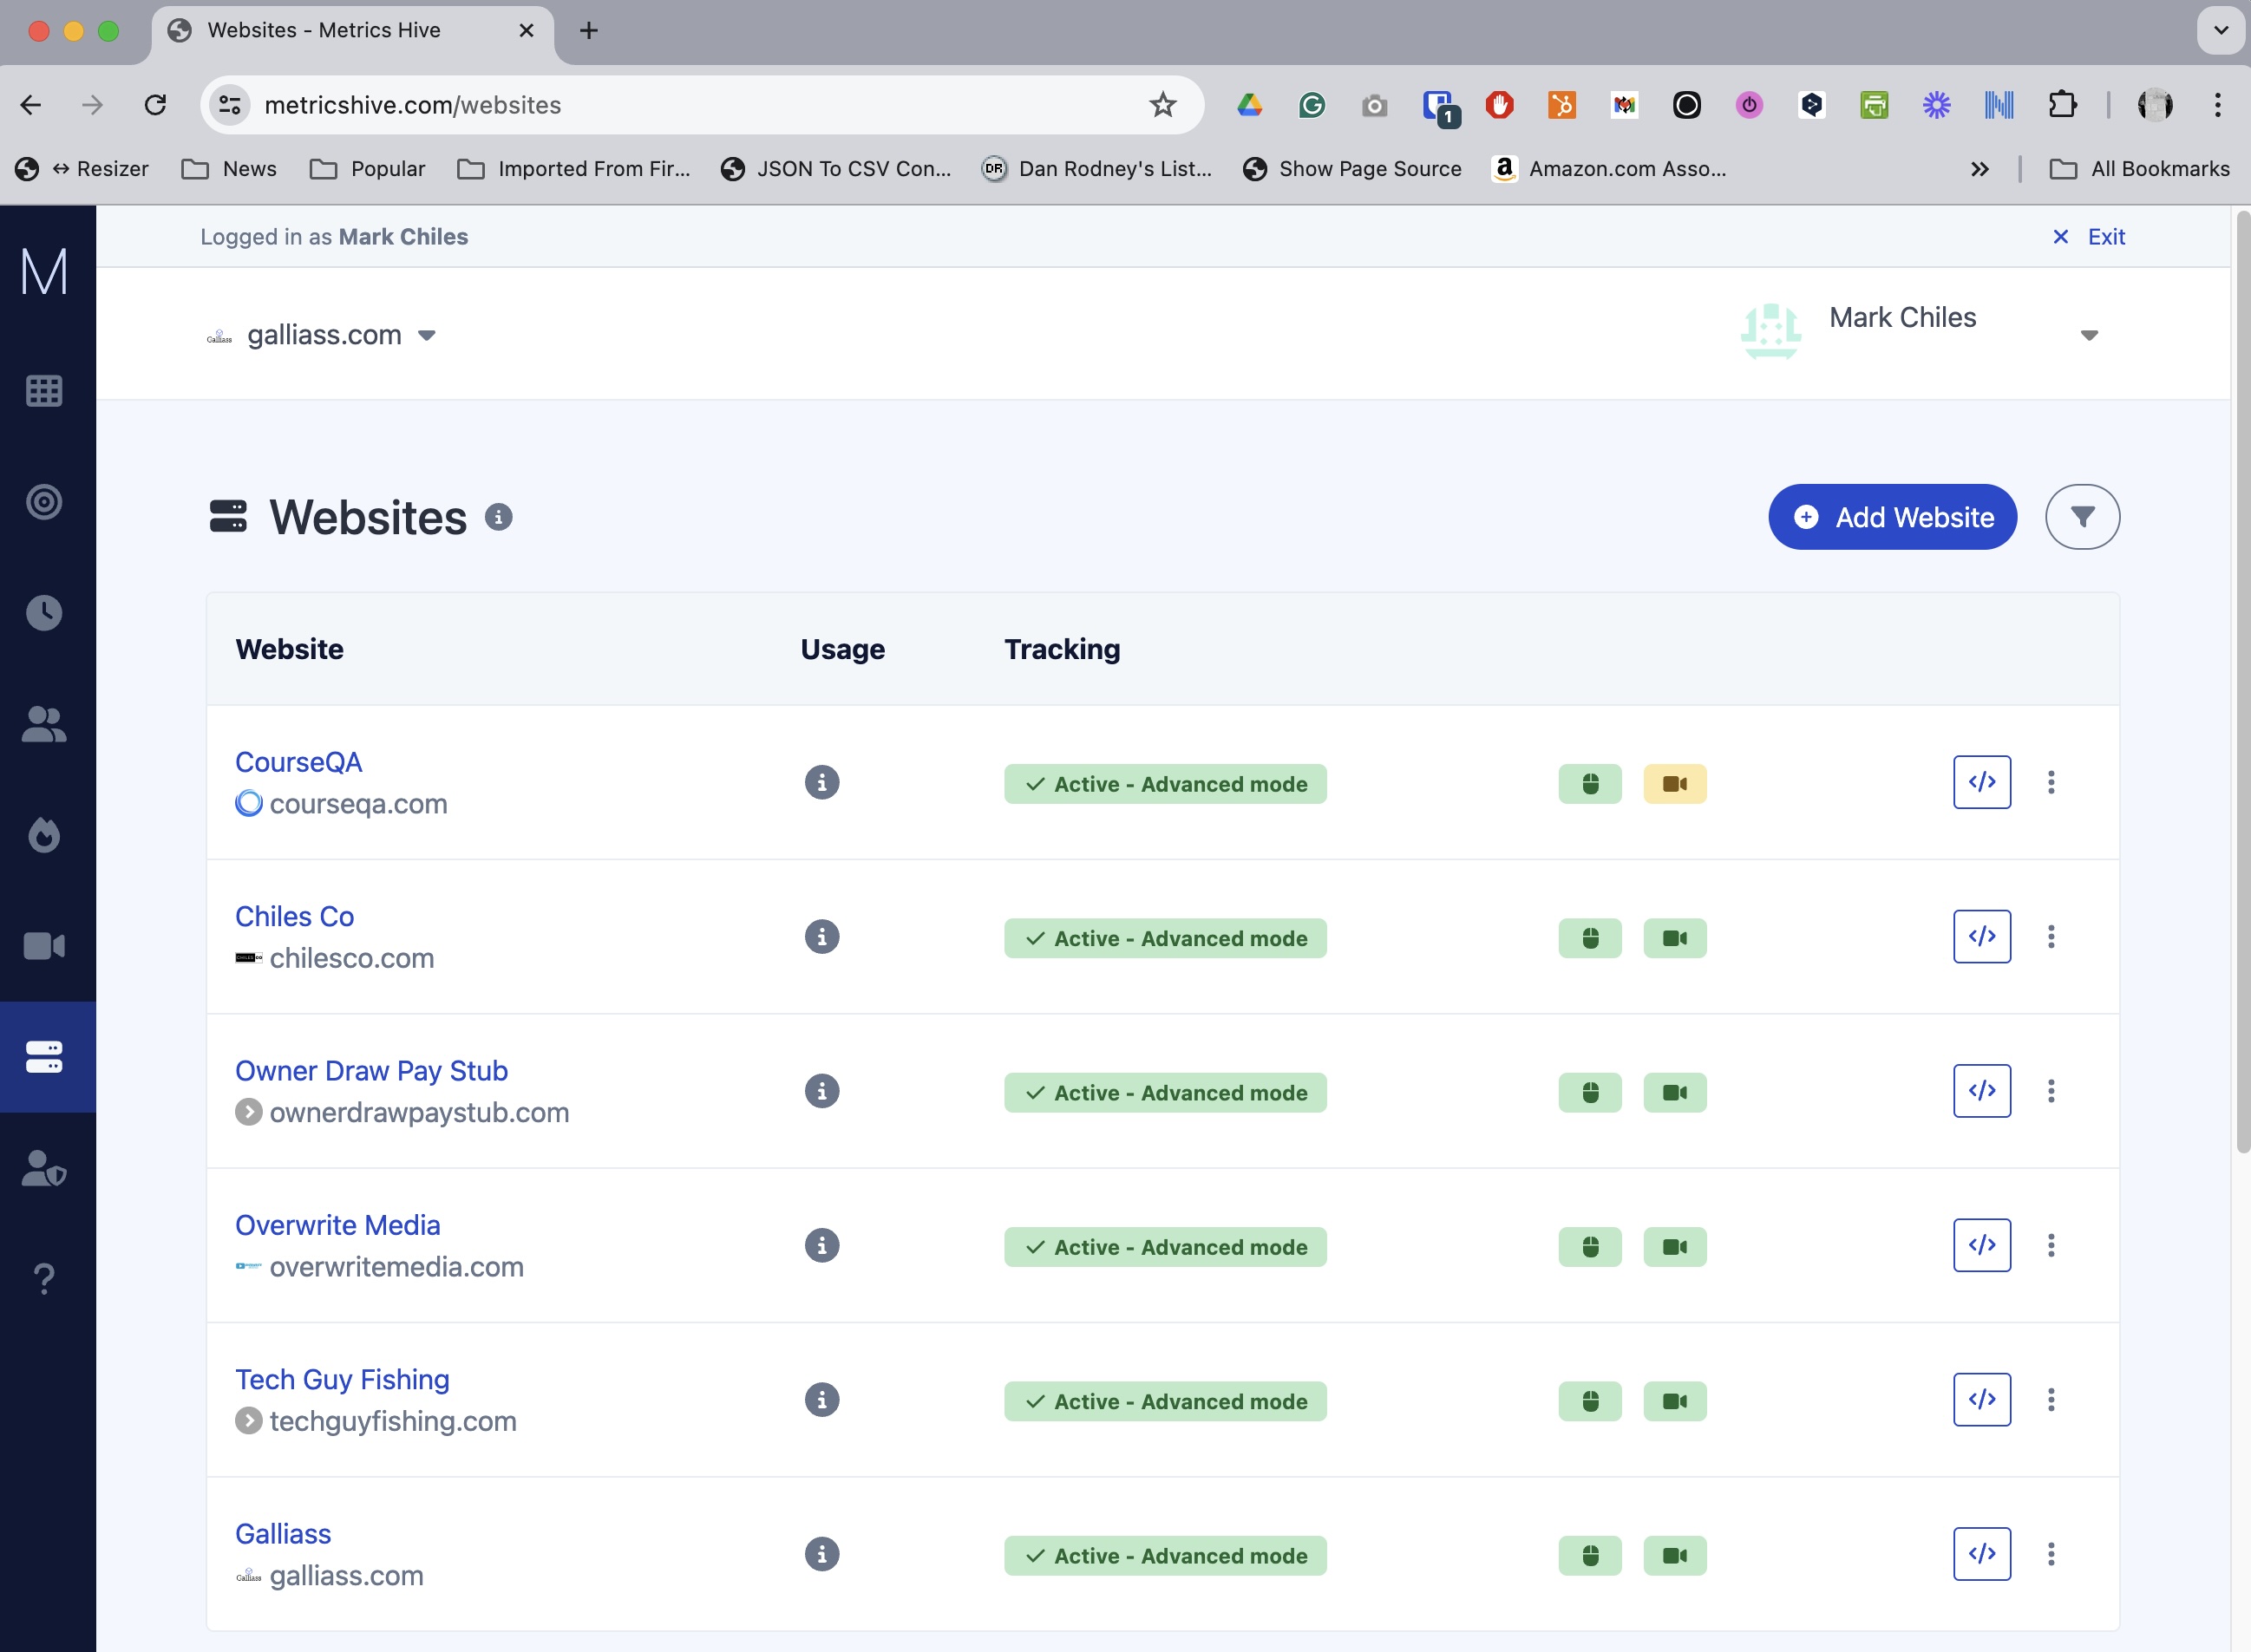
The dashboard contains all the high-level details you will need to know how your website is performing.
-
Get a quick overview of your pageviews, sessions, and visitors
-
Identify the top pages, countries, referrers
-
Navigate to more in-depth analytics
Realtime visitor analytics
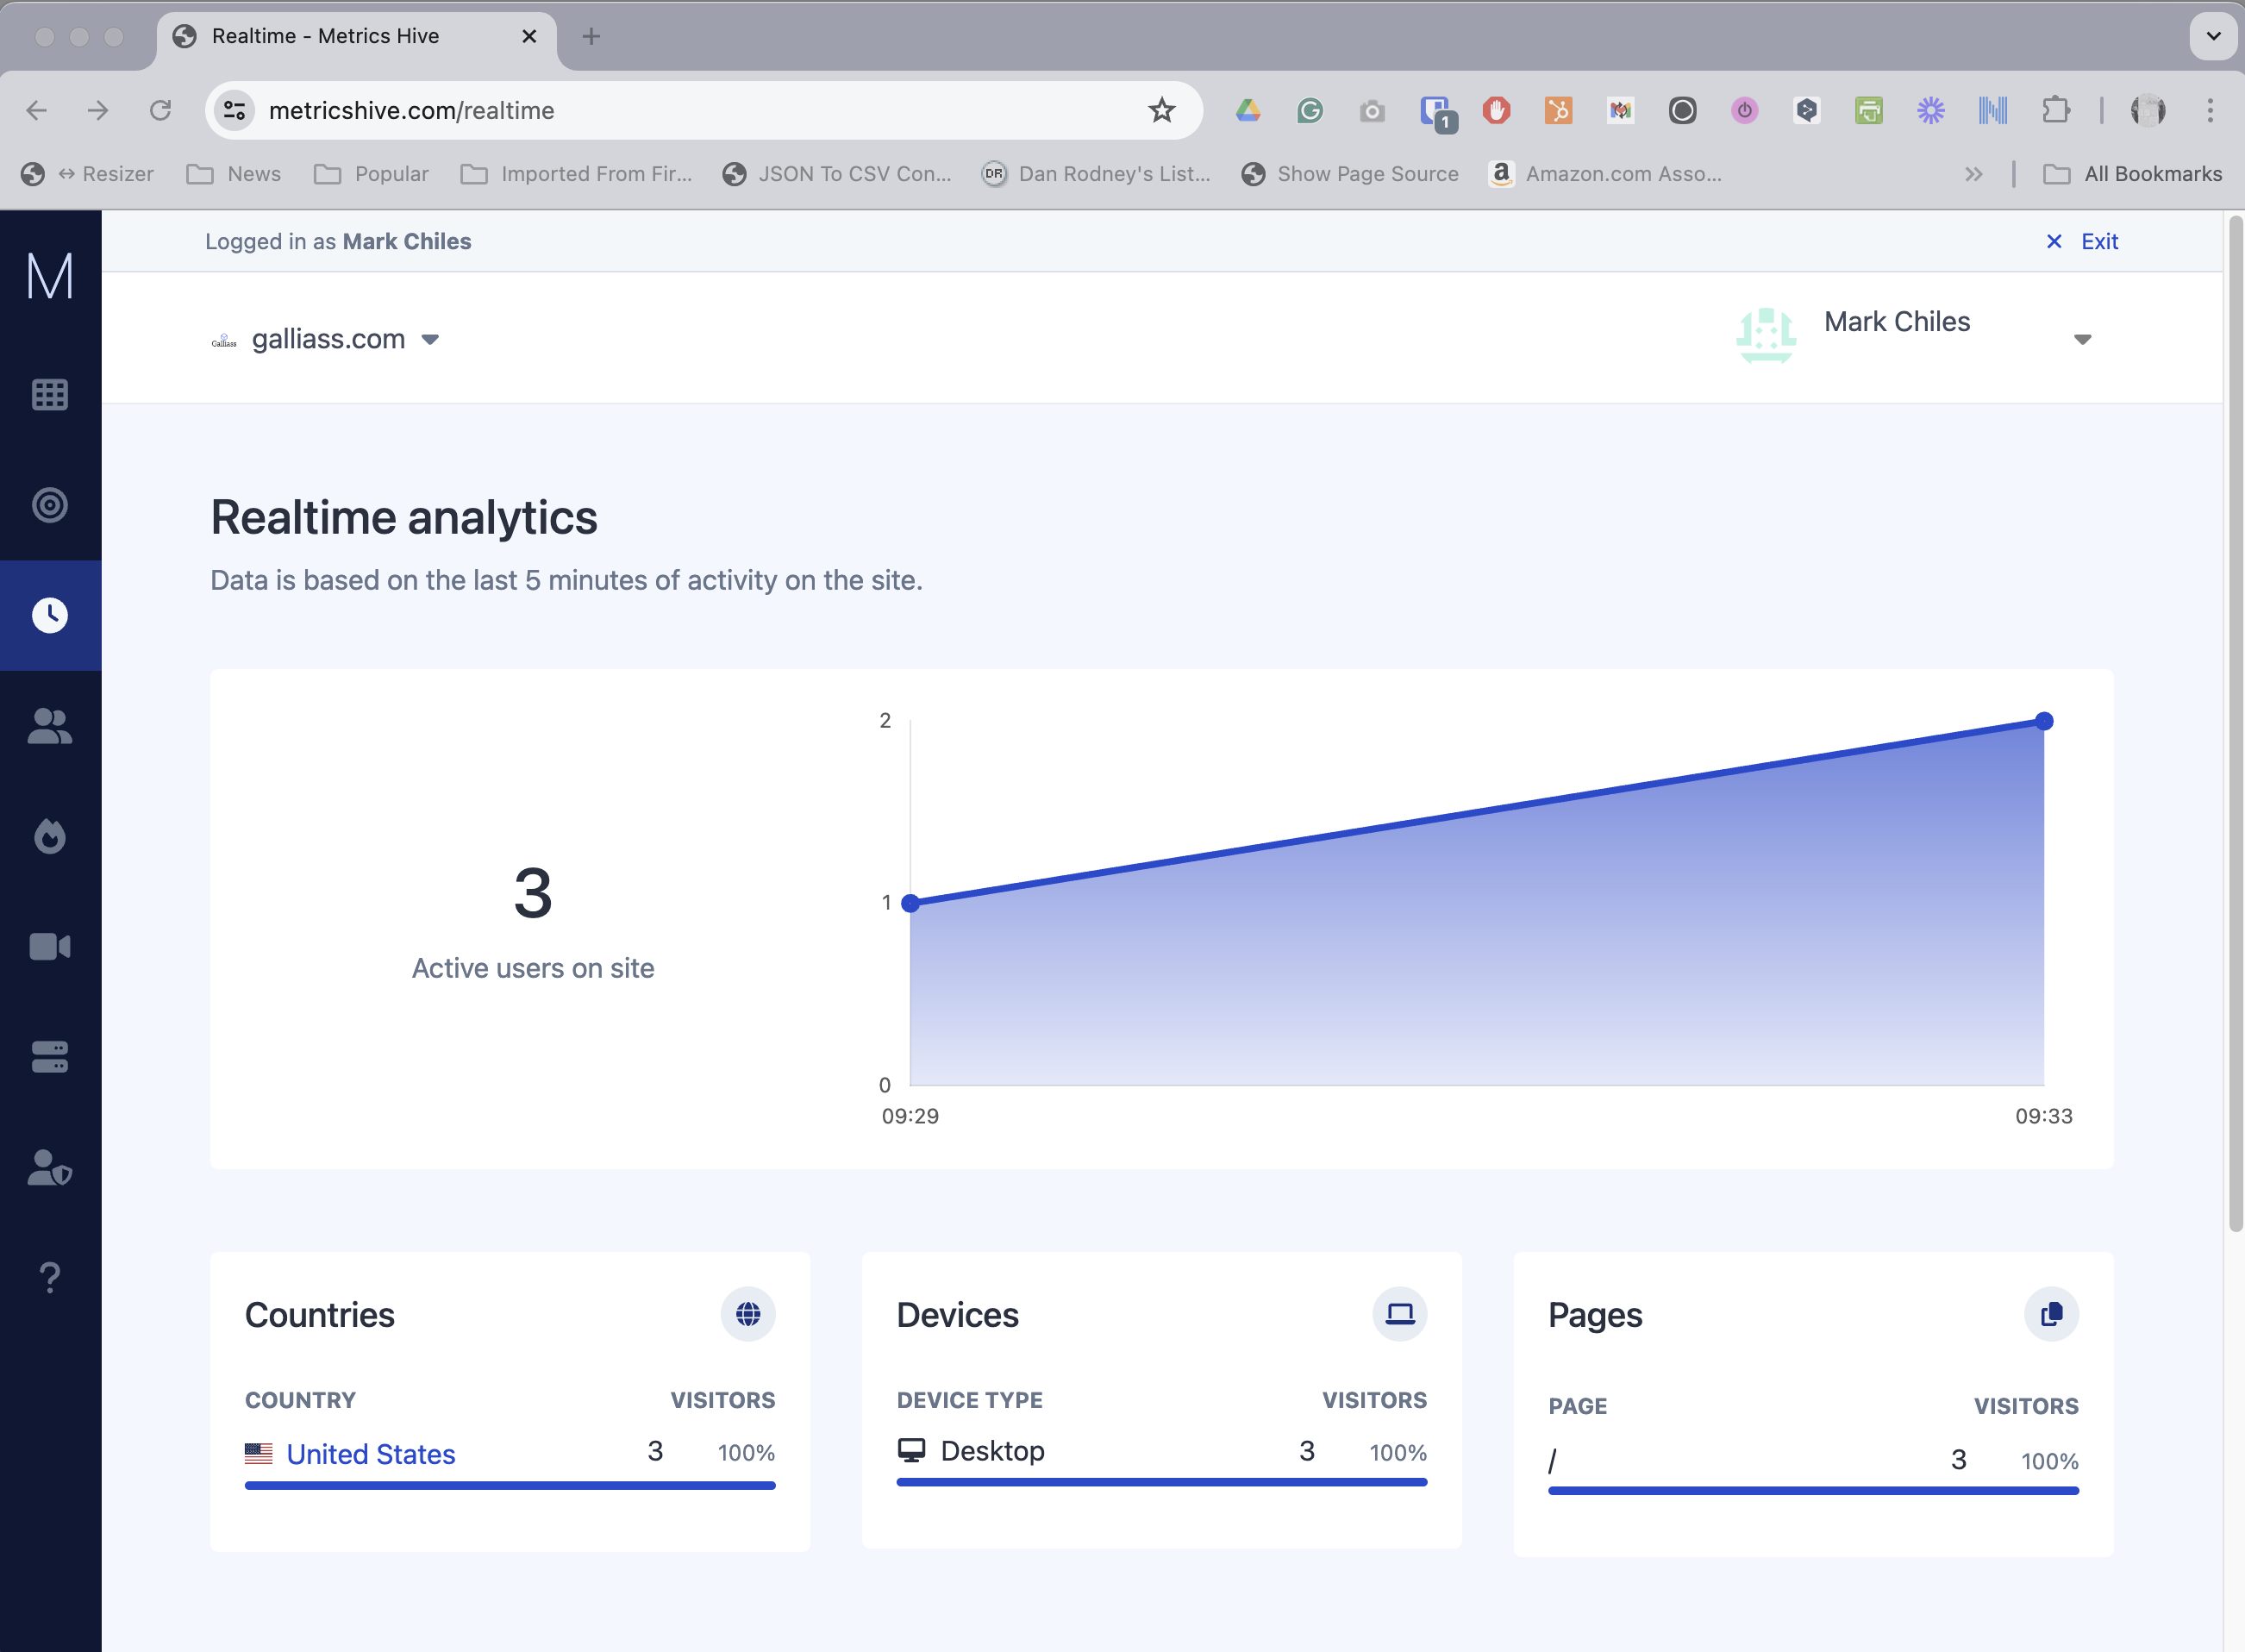
Curious to see realtime data? You can check and how many users are online, which devices are the most popular and what pages are most accessed.
-
See real-time active users
-
Discover which pages are being viewed
-
See the users' device type and location
Understand your users
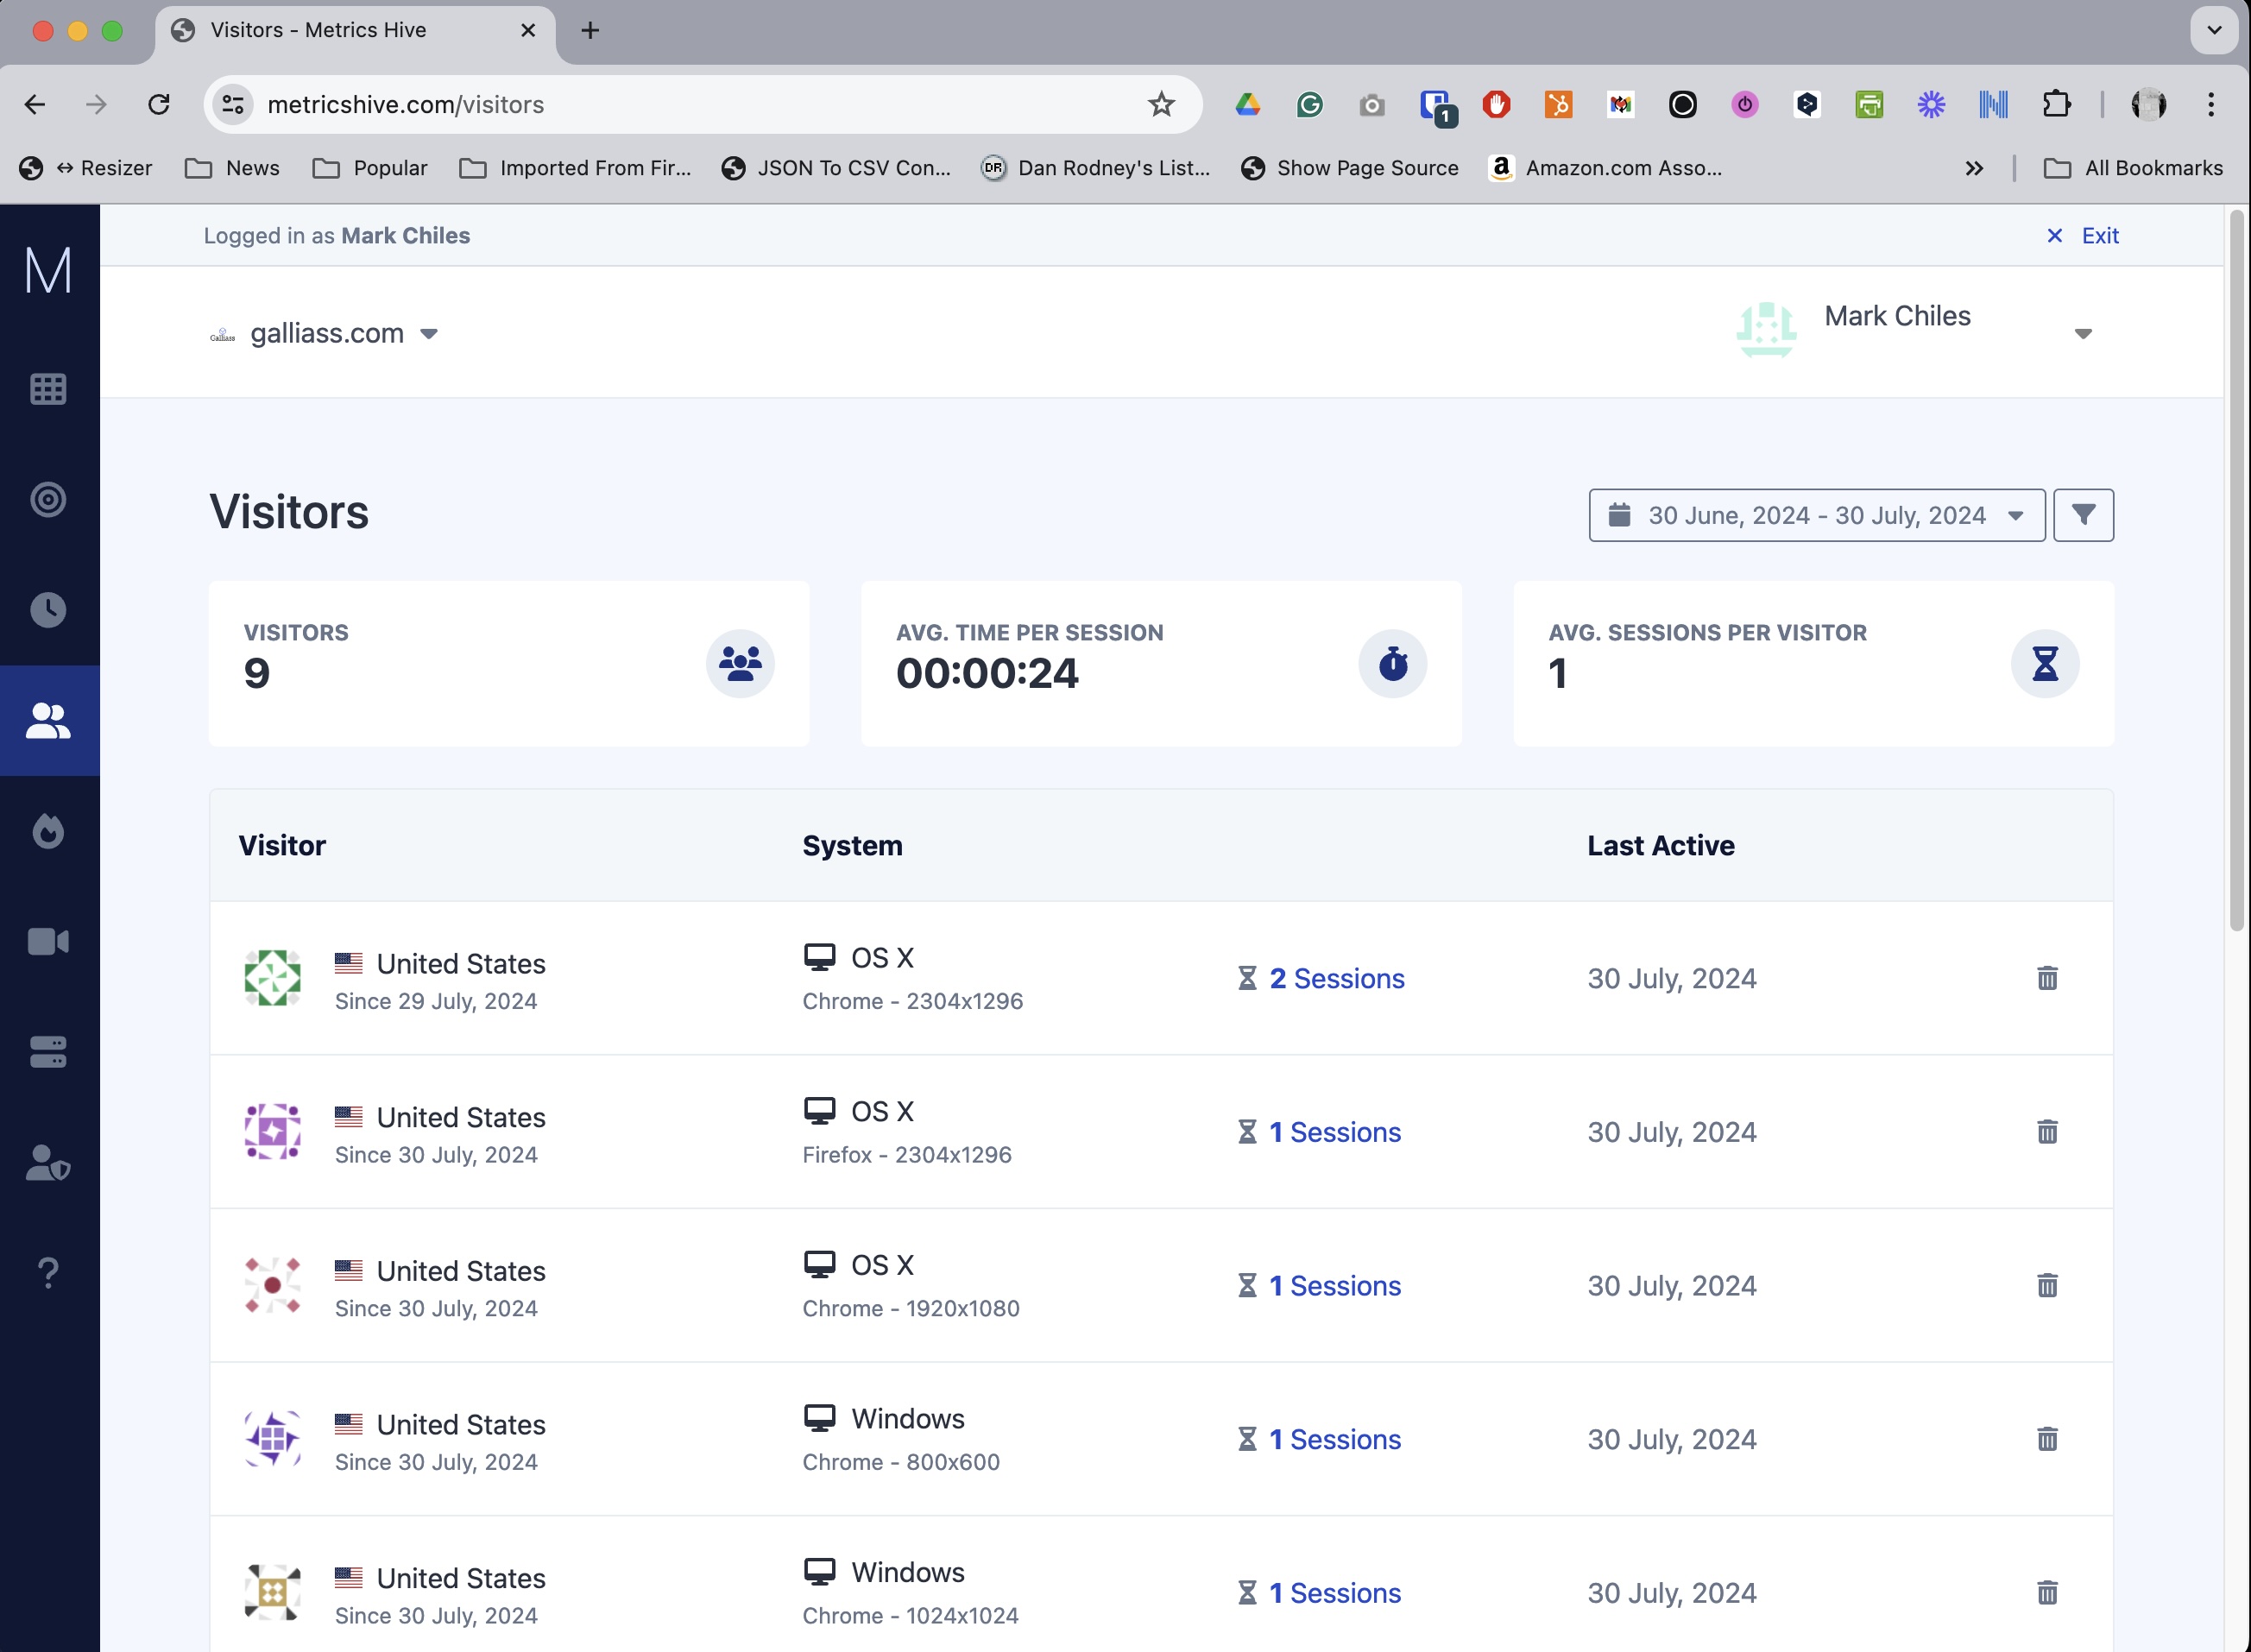
Understanding your users is key to learning how to improve your website. Check each visitor's path and under their journey on your site without intruding on their privacy.
-
View the details of all site visitors
-
Analyze session data, both past and present, to understand user flow
-
Link users with tracked sessions
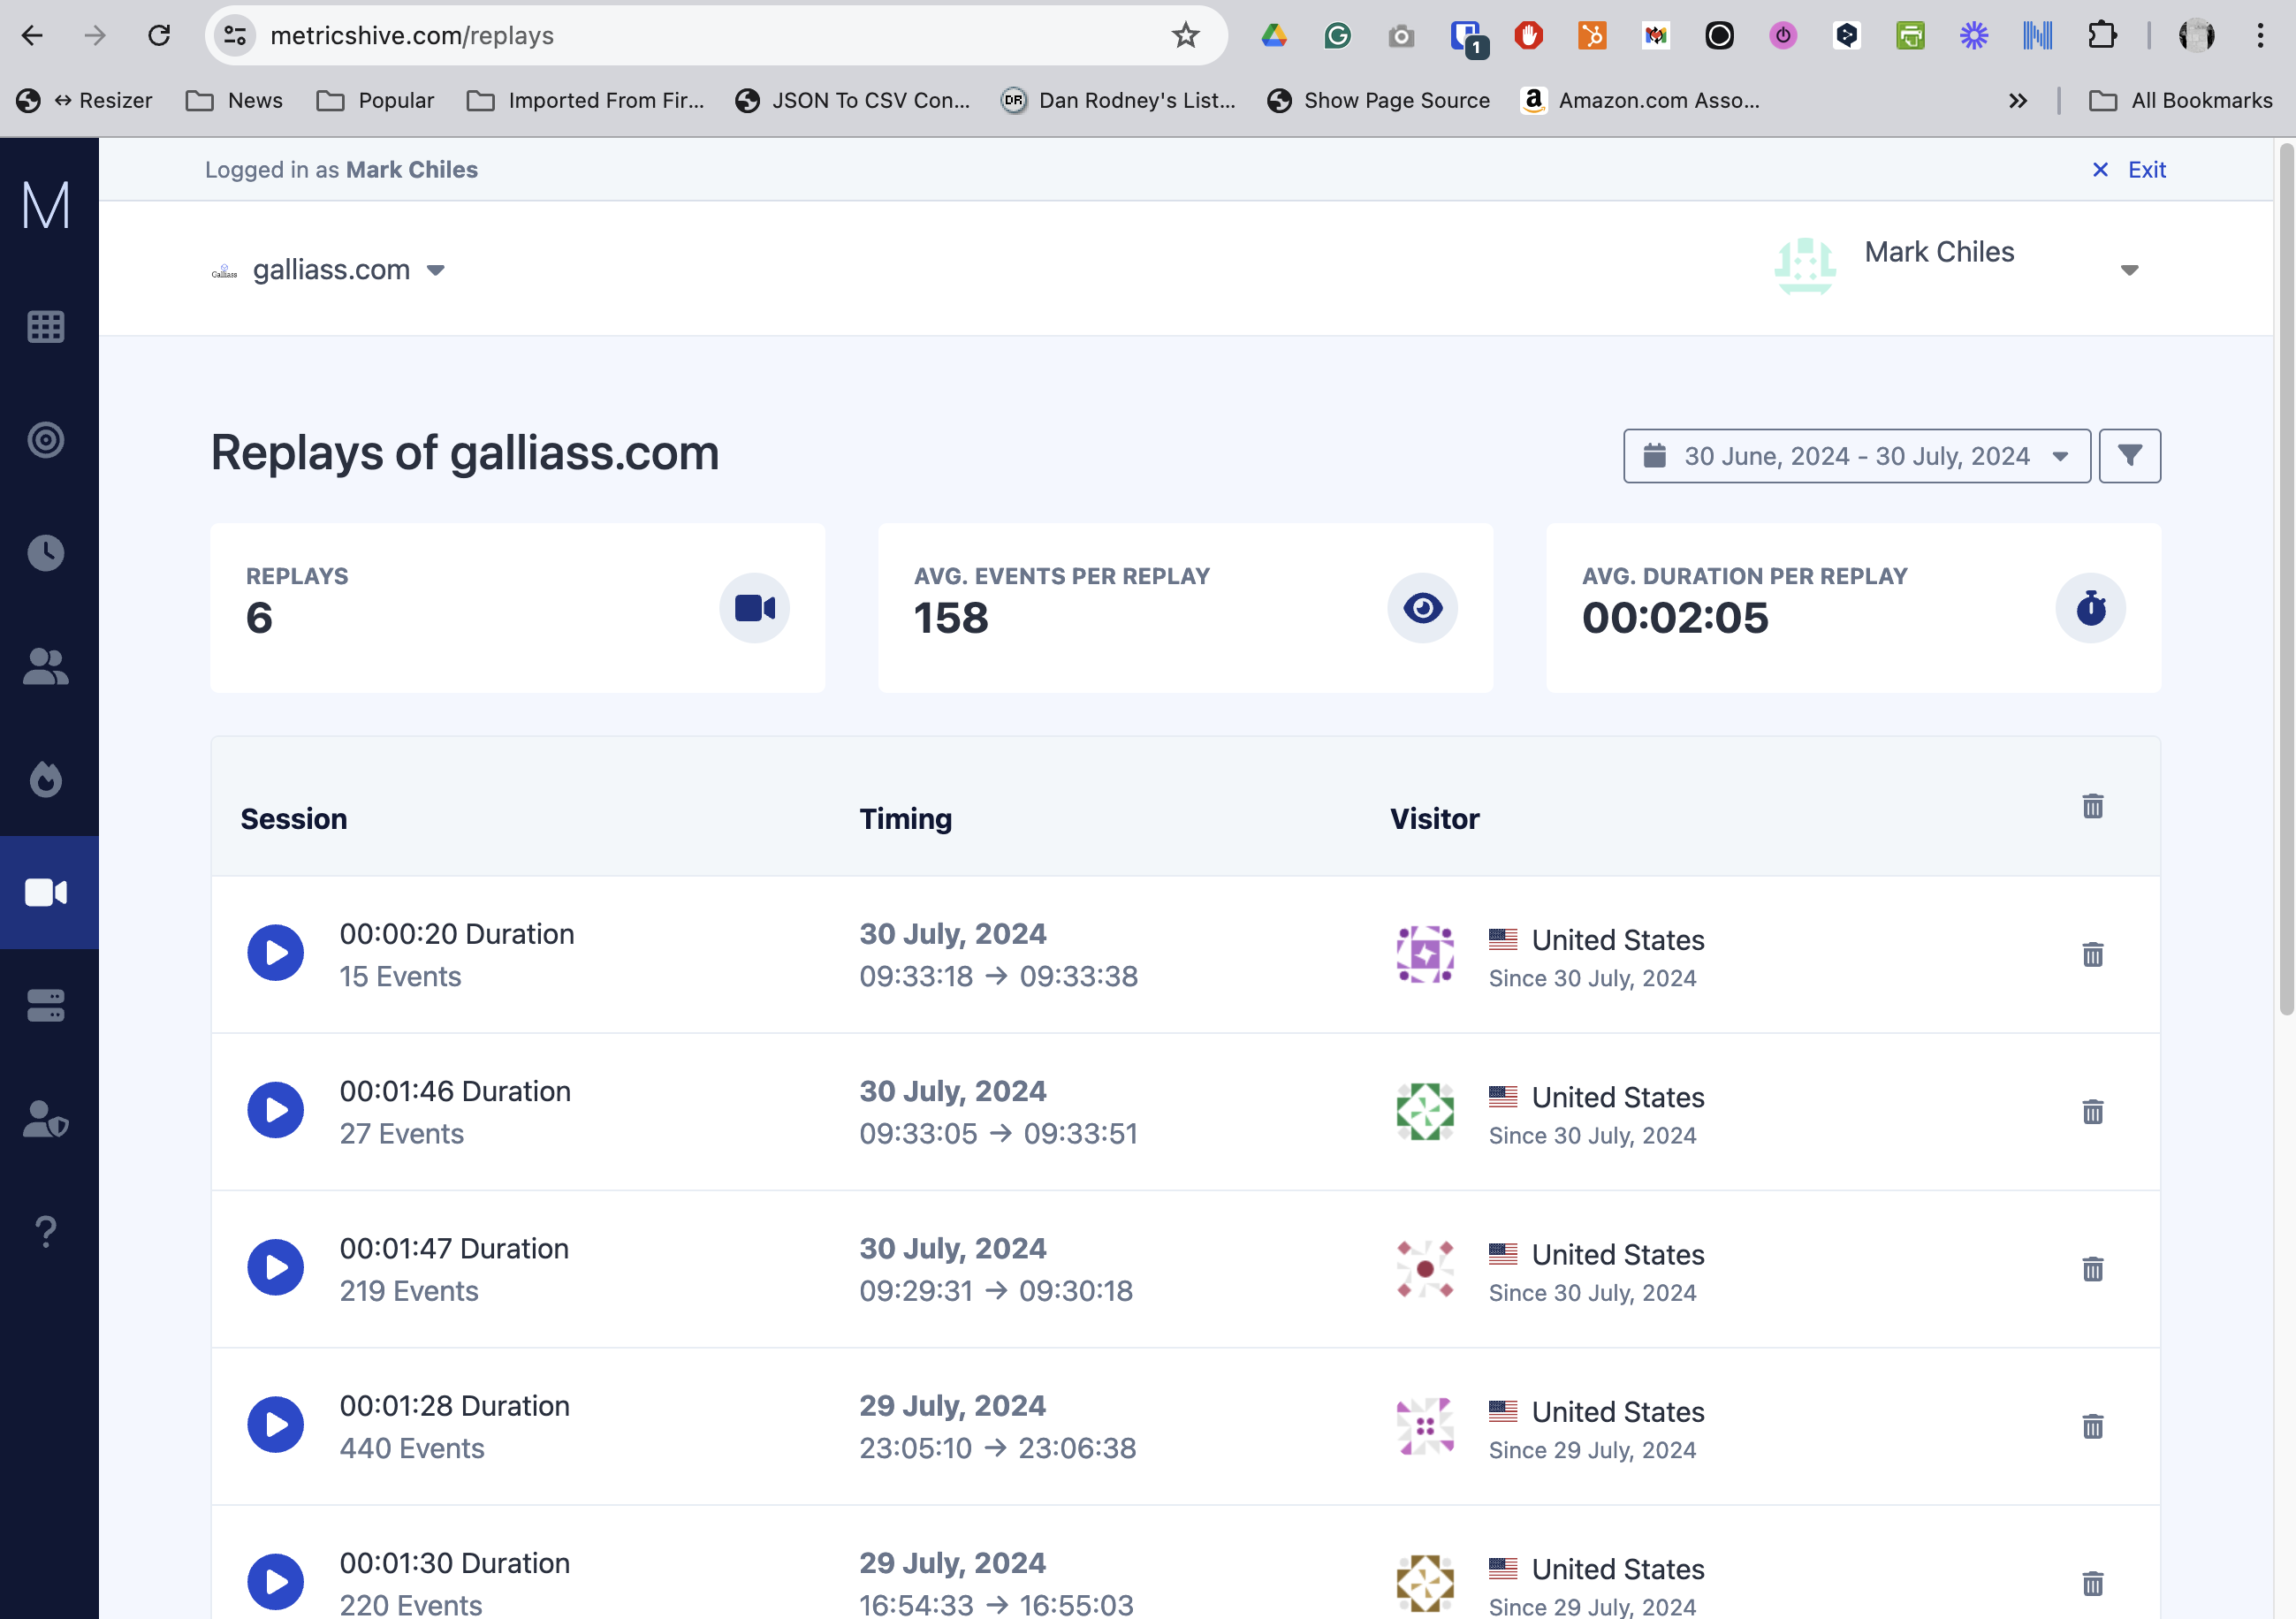
Record & replay visitors sessions
This is simply the best way to see a visitor's experience on your website about what they click on, where they're go, what they like, and what they do not understand. You can easily replay their sessions and see exactly what they did.
-
See a video replay of visitors using your site
-
Use high-quality visuals to pinpoint key areas on your site
-
Understand issues or changes that need to be made

Heatmaps tracking
Heatmaps are a powerful way to understand what users do on your website pages—where they click, how far they scroll, and what they look at or ignore.
-
See a graphical representation of data where values are depicted by color
-
Facilitate data analysis and get a snapshot understanding of how your target audience interacts with an individual website or product page
-
Get deep insights into people's behavior on your site to understand why users aren't adopting your product
Choose the perfect plan for you.
Pick and get your plan based on your needs.
Growth
-
3 Websites
-
15,000 Pageviews per month, per website
-
10,000 Visitor Events Tracking per month, per website
-
180 Day Data Retention for Visitor Events
-
100 Session Replays per month, per website
-
90 Day Data Retention for Sessions Replays
-
25 Website Heatmaps
-
25 Tracked Goals
-
Teams
-
API access
Business
-
50 Websites
-
100,000 Pageviews per month, per website
-
100,000 Visitor Events Tracking per month, per website
-
365 Day Data Retention for Visitor Events
-
100 Session Replays per month, per website
-
365 Day Data Retention for Sessions Replays
-
50 Website Heatmaps
-
100 Tracked Goals
-
Teams
-
API access
Enterprise
-
100 Websites
-
Unlimited Pageviews per month, per website
-
Unlimited Visitor Events Tracking per month, per website
-
365 Day Data Retention for Visitor Events
-
100 Session Replays per month, per website
-
365 Day Data Retention for Sessions Replays
-
Unlimited Website Heatmaps
-
Unlimited Tracked Goals
-
Teams
-
API access
Ready to move on from Google Analytics?
Simple, powerful analytics, all from a single line of code.